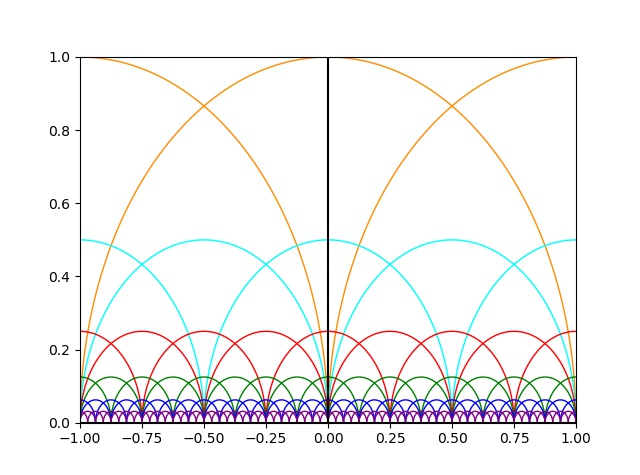
Here the code is.
| import numpy as np import matplotlib.pyplot as plt realaxis = np.linspace(-1.0, 1.0, 1000) imagaxis = np.linspace( 0.0, 1.0, 1000) zeros = np.linspace(0, 0, 1000) colorlist = [“red”, “green”, “blue”, “purple”, “darkorange”, “cyan”] theta = np.linspace(0, np.pi, 100) plt.axis(“off”) for n in list(range(0, 6)): n2 = np.power(2, n) for center in np.linspace(-1, 1, 2 * (n2 – 1) + 3): x = center + (1 / n2) * np.cos(theta) y = (1 / n2) * np.sin(theta) plt.plot(x, y, lw = 1.0, color = colorlist[n – 2]) plt.plot(realaxis, zeros, color = ‘black’) plt.plot(zeros, imagaxis, color = ‘black’) plt.xlim(-1.0, 1.0) plt.ylim(-0.0, 1.0) plt.show() |
Here the output is.
